Ürün Güncellemeleri
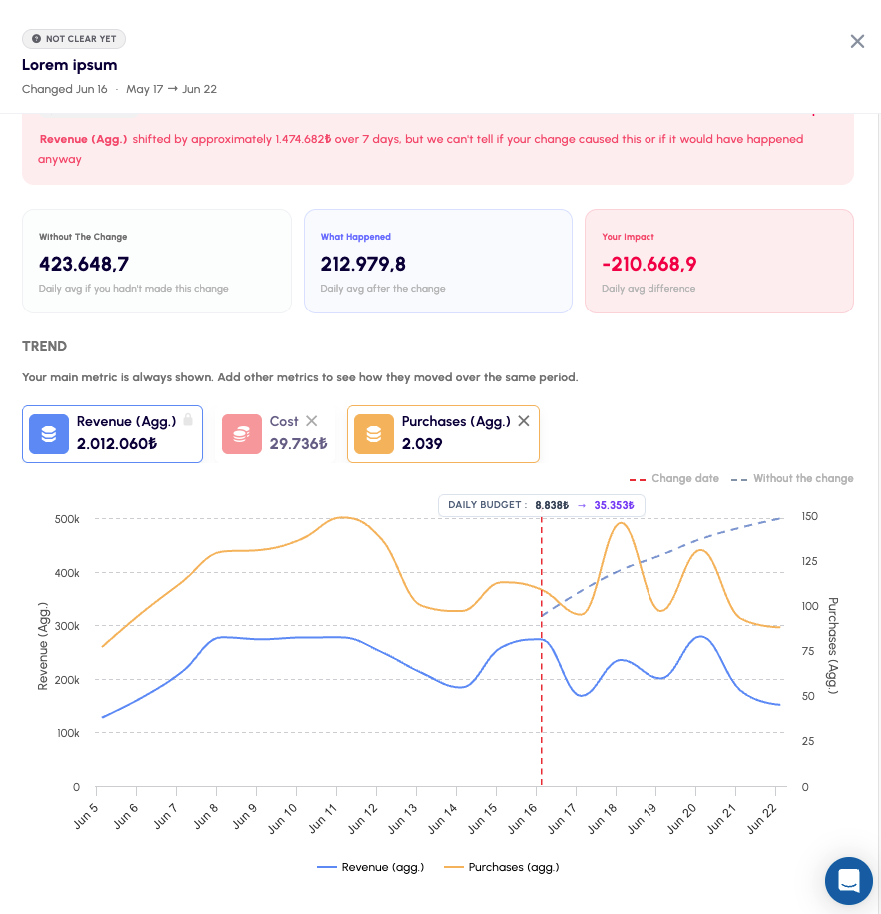
Compare metrics directly on the Impact Analysis trend chart
You can now overlay additional metrics on your Impact Analysis trend chart to see how everything moved around a change – not just your primary metric. Previously the chart showed only your primary metric with its actual and counterfactual (without-change) lines. Now you can add any of the control variables you defined during setup and plot them alongside, so you can eyeball how spend, conversions, ROAS or any other factor behaved over the same period – all in one view. Try Now!