Understanding ad creative performance has transcended luxury to become a necessity. Metrics such as click-through rates (CTR), engagement rate, video view rate, and hold ratio — hook rate offer crucial insights into your ads’ resonance with the target audience. Yet, relying solely on average performance metrics can be misleading due to creative fatigue — a phenomenon where viewers become desensitized to an ad after repeated exposure, diminishing its effectiveness. This article explores the nuances of ad creative effectiveness and fatigue detection, empowering marketers with deeper insights.
Understanding Ad Creative Performance
Ad creative performance is influenced by several factors:
- Placement: The significance of where and how your ad is displayed cannot be overstated. Ads positioned strategically on relevant platforms enhance user engagement.
- Audience: Tailoring your ad to reach the correct audience through precise targeting and relevant creatives is crucial. Knowledge of interests, demographics, and online behavior enables the crafting of impactful messages.
- Message: The essence of your ad lies in its message. Effective visuals, clear calls to action, and targeted messaging drive user actions and shape brand perception.
The Pitfall of Averages
Consider an ad that performs well initially but then reaches a plateau. Averages for specific time periods might imply consistent performance, concealing the truth — a decline in engagement due to creative fatigue. This scenario underscores the limitations of relying on averages and the value of delving deeper for a nuanced understanding of ad effectiveness.
The Necessity of Daily Performance Monitoring
Daily monitoring is essential. Time series analysis offers a robust tool for tracking and analyzing performance trends over time. It facilitates the visualization of engagement metrics evolution and the identification of potential declines induced by fatigue. Comparing creatives with similar placements and targeting provides additional insights.
Analyzing performance across all placements might be misleading. Detailed breakdowns for specific platforms provide deeper insights:
- Meta (Facebook & Instagram): Analyze device breakdowns, ad formats, placements, and audience demographics.
- TikTok: Consider completion rates, average watch time, and the performance of in-feed versus search ads.
- YouTube: Examine metrics by video position, device type, demographics, channels, and video categories.
Identifying and Calculating Creative Fatigue
Calculating Slope of Engagement:
- Gather daily engagement metrics data for your ad.
- In Google Sheets, enter your data with “Date” in one column and the metric in another.
- You can use SLOPE function for slope calculation
- In the “Y variable” field, select the metric column.
- In the “X variable” field, select the “Date” column.
- The output will include the slope coefficient. A negative coefficient indicates a declining trend.
Calculating Moving Average Slope of Engagement: This approach involves calculating the slope for a group of data points (e.g., the last 7 days) and moving the window forward over time. This method, sensitive to recent performance changes, requires careful consideration of rate metrics to avoid misleading conclusions due to varying daily volumes. You can follow same steps above just need to calculate moving average for last X days engagement metrics. (average should be weighted — do not calculate average of the ratio metrics)
The moving average slope can be instrumental in identifying the onset of creative fatigue. A declining rolling slope, even before reaching statistical significance, serves as an early warning sign.
Analyzing All Metrics Together
While analyzing all metrics at the ad level can be challenging, focusing on specific metrics for each platform can reveal what resonates with specific audiences. For instance, a high CTR on Facebook might signify effective brand awareness creatives, whereas low engagement on YouTube could indicate the need for more captivating video content.
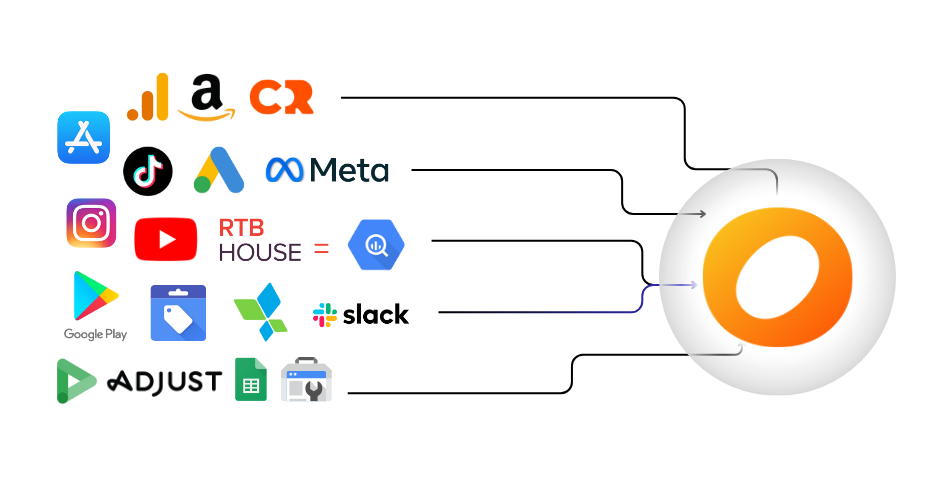
These challenges prompted the development of an ad creative analysis dashboard at Orphex, facilitating regular, detailed calculations and comparisons. This approach ensures marketers can detect creative fatigue early, optimizing campaign performance and avoiding unnecessary costs.
By implementing these detailed analyses and adopting a multi-metric perspective, marketers can achieve a comprehensive understanding of ad creative effectiveness and preemptively address creative fatigue, leading to a sustained campaign success.
Example Engagement Metrics:
- Click-Through Rate (CTR): Measures the percentage of viewers who click your ad. While valuable, a high CTR might not translate to conversions if the ad doesn’t resonate.
- Engagement Rate: Combines metrics like likes, comments, and shares to gauge audience interaction with your ad creative.
- Frequency: Measures how many times a user sees your ad. A high frequency alongside declining engagement metrics might indicate creative fatigue.
- Hook Rate: The percentage of viewers who watch past the first few seconds of your video ad. A high hook rate suggests the creative effectively captures attention.
- Video Completion Rate: The percentage of viewers who watch your entire ad video. A high completion rate indicates strong ad engagement.
- Average Watch Time: Measures the average duration users spend watching your ad video. This provides a clearer picture of engagement beyond completion rates.


 Agency Program
 Affiliate Program