PPC reporting tools are no longer optional for ecommerce teams managing multi-channel paid campaigns; they are the operational backbone of every data-driven marketing decision. As global PPC software market revenue is projected to grow from $20.5 billion in 2024 to $22.49 billion in 2025 at a CAGR of 9.8%, the pressure to measure, justify, and optimize every dollar spent has never been higher. Whether you are a performance marketing specialist running Google Shopping campaigns or a marketing director overseeing a seven-figure ad budget, the right PPC reporting tool determines how fast you can act on what the data is telling you. This article breaks down everything you need to know about choosing and using PPC reporting tools for ecommerce, from SKU-level visibility to ROAS-driven decision-making.
Why PPC Reporting Matters More Than Ever in Ecommerce
Ecommerce advertising has never been more complex. Paid search spending in the US alone reached an estimated $124.59 billion in 2024, representing an 11.1% year-over-year increase. Behind that number lies an overwhelming volume of campaign data spread across Google Ads, Meta, Amazon, and a growing list of platforms, all generating metrics that need to be consolidated, compared, and acted upon in near real time. For marketing managers juggling multiple channels, this fragmentation is not just inconvenient; it is a direct threat to campaign performance and budget efficiency.
The challenge compounds further when ecommerce businesses operate at scale. Running ads across hundreds or thousands of product SKUs means that a single underperforming product category can silently drain your budget while your top-level ROAS numbers still look acceptable on the surface. Automating PPC reporting can reduce your reporting time from three to seven days down to approximately one hour per month. That efficiency gain is the difference between reacting to a problem two weeks late and catching it before the budget burns. This is why serious ecommerce teams are replacing spreadsheet-based reporting with purpose-built PPC reporting tools that centralize data and surface insights automatically.
What Is a PPC Reporting Tool and How Does It Work?
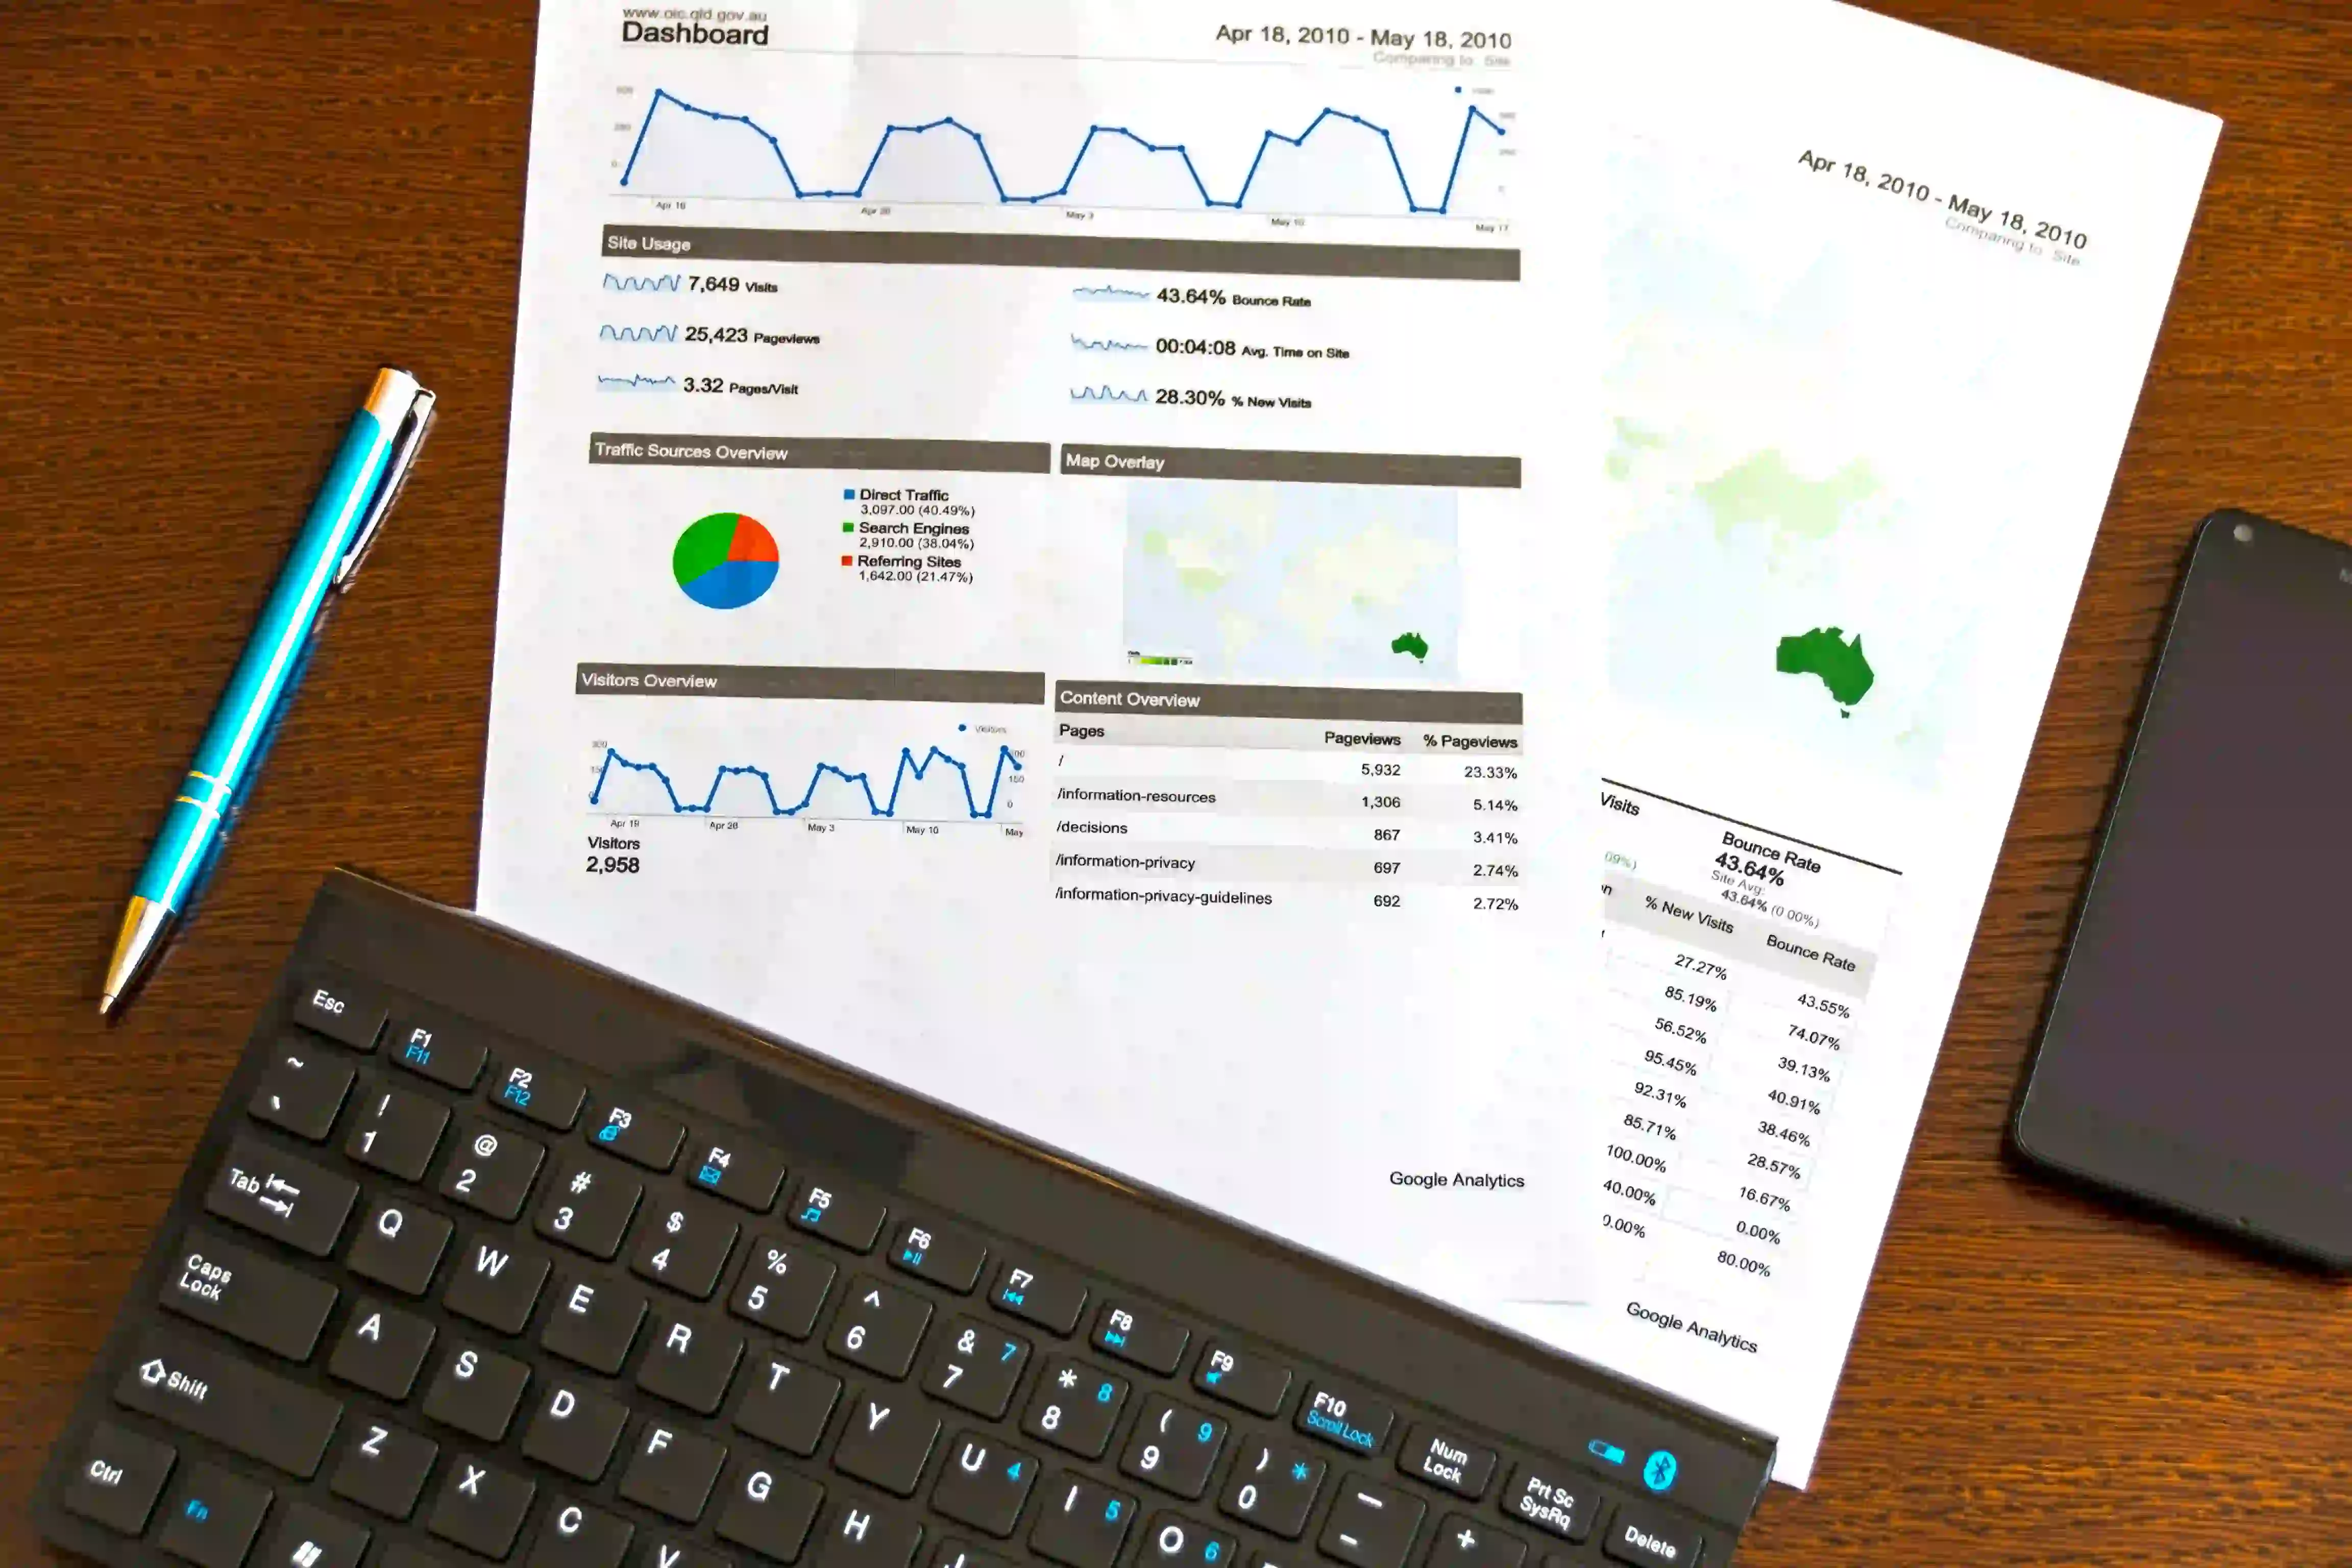
A PPC reporting tool is software designed to pull campaign data from one or more advertising platforms, unify it under a single interface, and present it in a structured, readable format, typically through dashboards, scheduled reports, and exportable data views. Rather than logging into Google Ads, Meta Ads Manager, and Microsoft Advertising separately to piece together a weekly performance picture, a reporting tool aggregates all of this automatically. The core mechanism relies on API integrations: the tool connects to each ad platform via an authenticated data pipeline and syncs campaign metrics at regular intervals, whether hourly or daily.
What separates a basic reporting layer from a genuinely useful PPC reporting tool for ecommerce is the depth of the data it can handle. Ecommerce-specific reporting must go beyond impressions and clicks. It needs to surface cost per acquisition by product category, ROAS broken down by SKU, and budget pacing against monthly targets, all in one place. Platforms with over 100 one-click integrations loaded with thousands of default metrics make automated reporting more comprehensive than ever before. However, breadth of integrations alone is not enough. The tool must also make it easy to slice the data in ways that reflect how ecommerce businesses actually operate: by product, by campaign type, by geographic market, and by device. When these dimensions are available in a single view, marketing teams can move from data collection to decision-making in a fraction of the time.
Key Metrics Every E-commerce PPC Report Must Include
Not all metrics belong in a PPC report, and not all metrics that belong in a PPC report carry equal weight. For ecommerce teams, the most dangerous trap is building dashboards around vanity metrics like raw impressions or click volume, while the numbers that actually reflect business health, such as ROAS, CPA, and conversion rate, get buried under noise. The average ROAS for ecommerce PPC campaigns sits at approximately 2.05, while the broader cross-industry average is just 1.55. Understanding where your campaigns stand relative to these benchmarks requires your reporting setup to surface the right figures instantly, without manual calculation.
The median ROAS for ecommerce brands in 2024 was 2.04, which means half of all ecommerce businesses were operating below a 2:1 return ratio. This is not necessarily a failure, because ROAS without margin context tells an incomplete story. A campaign returning 2.5x ROAS on a product with 70% margins is far more profitable than a 4x ROAS on a product with 20% margins. This is exactly why your PPC reporting tool must go beyond surface-level aggregation and allow you to layer in business context. The table below outlines the core metrics every ecommerce PPC report should track, along with benchmark ranges to help you interpret performance:
Metric | What It Measures | Ecommerce Benchmark |
ROAS | Revenue generated per $1 of ad spend | 2.0x to 4.0x (healthy range) |
CPA (Cost Per Acquisition) | Cost to acquire one paying customer | Varies by product margin |
CTR (Click-Through Rate) | Ad engagement rate | 1.8% to 3.2% (Google Shopping) |
Conversion Rate | Share of clicks that result in a purchase | 2.5% to 3.5% (ecommerce avg.) |
Impression Share | How often your ad shows vs. eligible impressions | 70%+ for branded campaigns |
Budget Utilization | Percentage of daily budget actually spent | 90%+ for active campaigns |
Cost Per Click (CPC) | Average cost paid per click | Varies by category and platform |
Going Beyond Campaign-Level Data With SKU-Level Reporting
Campaign-level ROAS can be deeply misleading in ecommerce. Consider a Google Shopping campaign with an overall ROAS of 3.5x. On the surface, this looks like a well-performing campaign. But within that campaign, 20% of your SKUs may be generating 80% of the revenue while the remaining 80% of products are draining budget with zero conversions. Without SKU-level visibility in your PPC reporting tool, you will never catch this imbalance, and you will continue funding underperforming products simply because the campaign aggregate looks acceptable. A sound ROAS strategy means setting a higher bar for proven hero SKUs while allowing a more flexible target for non-branded growth terms, so that growth-stage products do not get starved of budget. Executing this strategy requires reporting that operates at the product level, not just the campaign level.
This is the exact pain point that most standard reporting dashboards fail to address. Generic PPC tools report at the campaign or ad group level. E-commerce brands managing hundreds or thousands of product lines need something more surgical. They need to know which item IDs are delivering profitable ROAS, which product categories are burning budget without converting, and how performance shifts across devices and geographies at the SKU level. This level of granularity transforms reporting from a backward-looking exercise into a forward-looking optimization tool.
Problem: Your marketing team reviews ROAS every week, but the data comes from three separate platform dashboards. By the time the numbers are consolidated in a spreadsheet, the week is over and you have already missed your budget pacing window.
Solution: Orphex is an online marketing platform built to unify campaign management, budget tracking, and performance reporting in a single workspace. With Orphex, ecommerce teams get product-level visibility across channels, real-time budget pacing, and cross-platform ROAS tracking, all without switching tabs or building manual reports.
Budget Distribution Across Channels: The Real Pain Point for Marketing Managers
Ask any performance marketing manager what their biggest daily challenge is, and the answer is almost always some version of the same problem: budget allocation across multiple channels with no single source of truth. Google Ads, Meta, Amazon Sponsored Products, and Microsoft Advertising all have their own dashboards, their own reporting cadences, and their own attribution logic. When your monthly ad budget is split across four or five platforms, understanding which channel deserves more investment requires consolidating data that was never designed to be consolidated. Global social media ad spending alone has grown by 140% in under five years, reaching an estimated $234.14 billion. As spend grows, so does the complexity of managing where that money actually goes and whether it is working.
The risk of fragmented budget visibility is not just inefficiency; it is direct revenue loss. When one channel overspends its monthly allocation by 15% because no one caught the pacing issue in time, that budget comes from somewhere else. Often, it comes from a higher-performing channel that gets underfunded in the second half of the month. Research shows that businesses using automated bidding and budget management strategies can see up to a 20% increase in ROI compared to teams relying on manual methods (Google Ads Smart Bidding Performance Report). The implication is clear: the gap between manual budget oversight and tool-assisted management is measurable in revenue terms. Marketing directors need a reporting layer that tracks budget pacing across all active channels simultaneously, flags overspend risk before it happens, and makes cross-channel reallocation decisions faster and more defensible.
How to Evaluate a PPC Reporting Tool for Ecommerce
Choosing the wrong PPC reporting tool is an expensive mistake, not just financially, but operationally. A tool that looks impressive in a demo but cannot pull SKU-level data from your product feed, or one that supports only two of your five active ad channels, will quickly become a source of frustration rather than clarity. Before committing to any platform, ecommerce marketing teams need to evaluate each tool against a structured set of criteria that reflects how they actually run campaigns. The most critical KPIs to verify in any reporting environment are CPA, ROAS, Conversion Rate, and Quality Score, and your tool must be able to track all of these across channels simultaneously, not channel by channel in isolation.
Automated bidding options such as Target ROAS, Target CPA, or Maximize Conversions work best when there is enough historical conversion data for the algorithms to learn from (Google Ads Help: About Smart Bidding). This means your reporting tool must also serve as a reliable data archive, not just a real-time dashboard. If your tool cannot retain and surface historical performance data at a granular level, your automated bid strategies will be operating blind. Use the checklist below as a minimum evaluation standard before selecting any PPC reporting tool for your ecommerce operation:
Must-Have Features Checklist:
Cross-channel data integration (Google Ads, Meta, Amazon, Microsoft)
SKU-level and product ID reporting
Real-time budget pacing and overspend alerts
Customizable dashboards with role-based access (specialist vs. director view)
Automated scheduled reporting (daily, weekly, monthly delivery)
Attribution modeling options (last click, data-driven, linear)
Historical data retention of at least 24 months
ROAS and CPA segmentation by device, geography, and audience
Common PPC Reporting Mistakes Ecommerce Teams Make
Even experienced performance marketing teams fall into predictable reporting traps that quietly cost them revenue. The most common is over-reliance on last-click attribution, which systematically undercredits upper-funnel channels like display and video while overcrediting the final touchpoint before conversion. In ecommerce, where a customer might discover a product through a YouTube ad, revisit via a Google Shopping result, and finally convert through a branded search, last-click attribution gives 100% of the credit to that branded search. This distorts budget allocation decisions at scale. Ecommerce teams should layer cohort views and segment splits rather than relying purely on top-level CPA and ROAS numbers, because aggregate metrics hide the performance variation that actually drives optimization decisions.
The second critical mistake is treating reporting as a backward-looking activity rather than a forward-looking tool. Many ecommerce teams build weekly reports that describe what happened last week: impressions went up, CPC went down, ROAS held steady. But without benchmarks, anomaly detection, and budget pacing projections built into the reporting layer, these reports inform without enabling action. PPC campaign audits are recommended at least every three to six months, but performance marketing teams managing ecommerce campaigns at volume need to operate on a much tighter review cadence: daily pacing checks, weekly metric analysis, and monthly full-account reviews as a minimum. When your reporting tool automates this cadence, marketing directors stop chasing data and start making decisions.
Problem: Your reporting stack includes three separate dashboards, a weekly spreadsheet consolidation process, and a monthly manual report that takes your team two full days to prepare. By the time insights reach the director level, the optimization window has closed.
Solution: Orphex eliminates this workflow entirely. As a unified online marketing platform, Orphex connects your active advertising channels, automates budget pacing alerts, and delivers cross-channel ROAS visibility without the spreadsheet overhead. Marketing managers get daily insights; directors get the strategic overview, all from the same workspace.
Frequently Asked Questions About PPC Reporting Tools for Ecommerce
What is a PPC reporting tool and why does an ecommerce business need one?
A PPC reporting tool is software that connects to one or more advertising platforms, pulls campaign performance data automatically, and presents it in a unified, readable format. For ecommerce businesses, the need goes beyond convenience. Running paid campaigns across Google Shopping, Meta, and Amazon simultaneously means managing thousands of data points that live in completely separate systems. Without a reporting tool to consolidate this data, marketing teams spend more time collecting numbers than acting on them. A purpose-built PPC reporting tool gives ecommerce marketers a single source of truth for budget pacing, ROAS performance, and campaign health, across every channel, every day.
How is a PPC reporting tool different from the native dashboards inside Google Ads or Meta Ads Manager?
Native platform dashboards are designed to show you performance within that platform only, using that platform's own attribution logic. Google Ads will not show you how your Meta campaigns are performing, and neither will give you a cross-channel ROAS view that accounts for budget allocation across all active channels. A dedicated PPC reporting tool pulls data from all connected platforms and presents it in a unified environment with consistent metric definitions. This cross-channel visibility is essential for ecommerce teams making budget reallocation decisions, because a choice to increase Google Shopping spend always comes at the cost of another channel, and that tradeoff needs to be visible in one place.
What metrics should I prioritize in my PPC reports for ecommerce?
For ecommerce, the highest-priority metrics in any PPC report are ROAS segmented by product category, CPA benchmarked against product margin, budget utilization rate across all active channels, and conversion rate broken down by device and geography. Impression share matters for branded campaigns specifically, because a drop in branded impression share often signals a competitor entering your space or a bidding issue that needs immediate attention. Beyond these core metrics, SKU-level performance data is the most actionable layer, because it tells you not just whether your campaigns are working, but which specific products are driving results and which are quietly wasting budget.
How often should ecommerce teams review PPC performance reports?
The review cadence depends on the scale of the ad budget and the number of active channels, but a practical baseline for ecommerce teams is daily budget pacing checks, weekly campaign performance reviews, and monthly full-account analysis. For high-spend campaigns or during seasonal peaks like Q4, daily performance monitoring becomes essential because budget can be consumed in hours rather than days. The goal of increasing review frequency is not to micromanage bids but to catch anomalies early: a sudden CPC spike, an unexpected ROAS drop on a top-performing SKU, or a budget overspend in one channel that is starving another.
Can a PPC reporting tool help with budget distribution across multiple channels?
Yes, and this is one of the most impactful use cases for a PPC reporting tool in ecommerce. Budget distribution decisions, such as how much goes to Google Shopping versus Meta versus Amazon, are among the highest-stakes choices a marketing manager makes each month. Without a tool that tracks actual spend and pacing across all channels in real time, these decisions rely on instinct rather than data. A good PPC reporting tool shows you budget utilization per channel against your monthly allocation, flags overspend risk before it occurs, and helps you identify which channels are delivering the strongest ROAS so that reallocation decisions are grounded in performance evidence rather than assumption.
